
S&W Revolver Cylinder (Note: this is a JC Blauvelt custom moon-clip job. Look closely! Nice work).
We’re going to start with a disclaimer: ATF trace data is not a real solid statistical base for anything. The firearms that are traced are not a random sample, but tend to be crime guns, found guns, and recovered thefts; and the ATF discourages local PDs from requesting tracing of older guns. (For political reasons, they’re trying to drive time-to-trace, which they disingenuously call time-to-crime, down). So a gun’s presence in the data depends somewhat on how ugly it is, and how new. But it struck us that they did collect a lot of data, so the Law of Large Numbers might be working for us, a wee bit. And they break down the data by both state (or territory) and by type of firearm, allowing all kinds of creative crosstabs, in this case, pistols and revolvers by state (or states by percentages of pistols and revolvers).
It struck us further: if revolvers are more or less commonly traced than average, the data may represent the degree to which there are regional variations in automatic pistol vs. revolver preferences. (Almost all “pistols” on the ATF list are automatics, although there may be occasional oddities in there). Again, this is limited by the non-representative nature of ATF trace data.
All in all, the trace data show that ATF traced 175,361 handguns in calendar 2014. Of these, 131,562 were pistols and 43,799 were revolvers, a 75.0/25.0% breakdown. How much do individual states vary from that? Extracting the pistol and revolver data from the ATF’s spreadsheet, we made our own. First thing we ran was the MIN and MAX formulas, determining that the range of percentages was from 14% to 50%.
The first revelation: not a single state or territory saw that a majority of traced handguns were revolvers. Not one. And only one split fifty-fity, and it turned out to be a very peculiar place indeed. To give you an idea of how far out of whack that was, the next highest percentage of revolvers traced was barely more than 1/3: 33.8%.
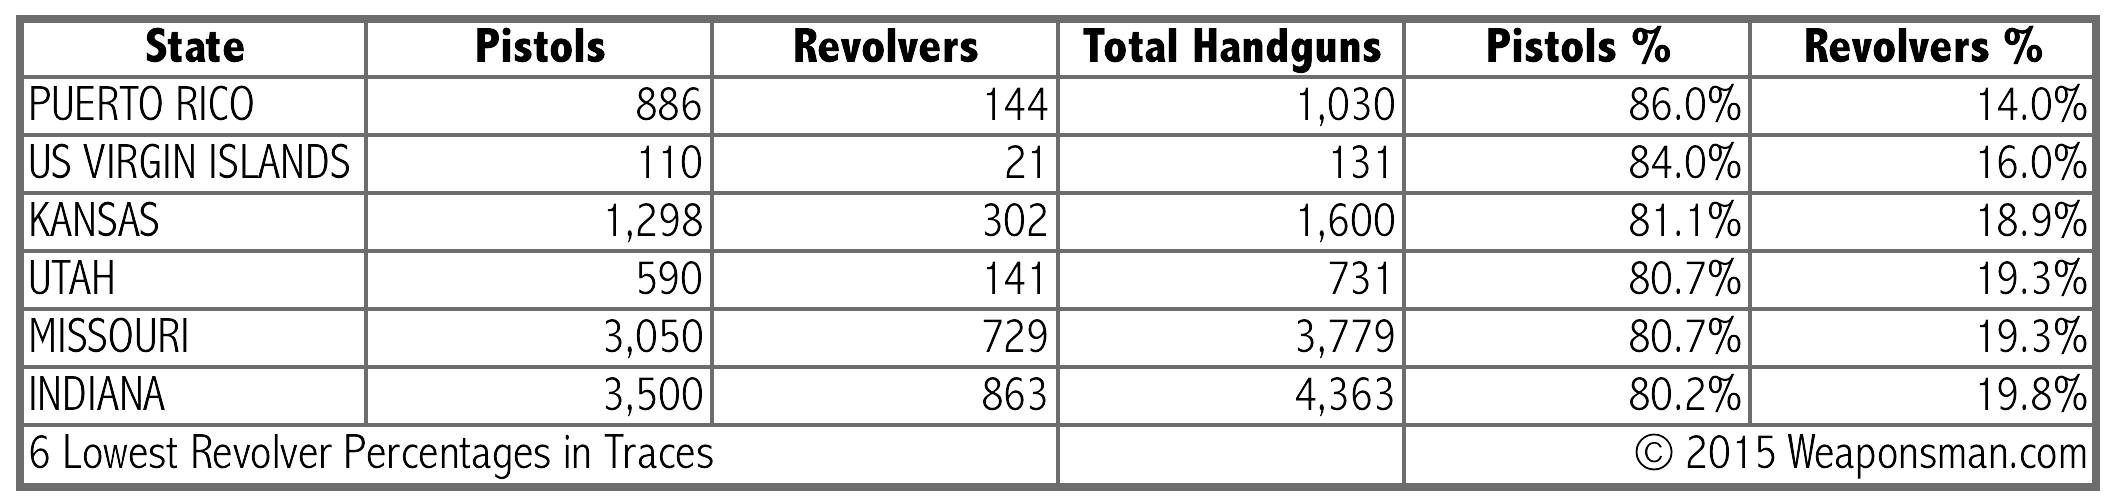
The high scorer on percentage of revolvers was a case where the law of large numbers probably wasn’t working for us: only 18 handguns were traced in the territory of Guam and the Northern Marianas Islands, 9 each pistols and revolvers (50% revolvers). The low scorer was another territory, Puerto Rico; of the 1,030 handguns traced there, 886 were pistols and only 144 revolvers (14%).
To show that Guam was really an outlier, off 16% from the next state, here it is with the next five states in order:
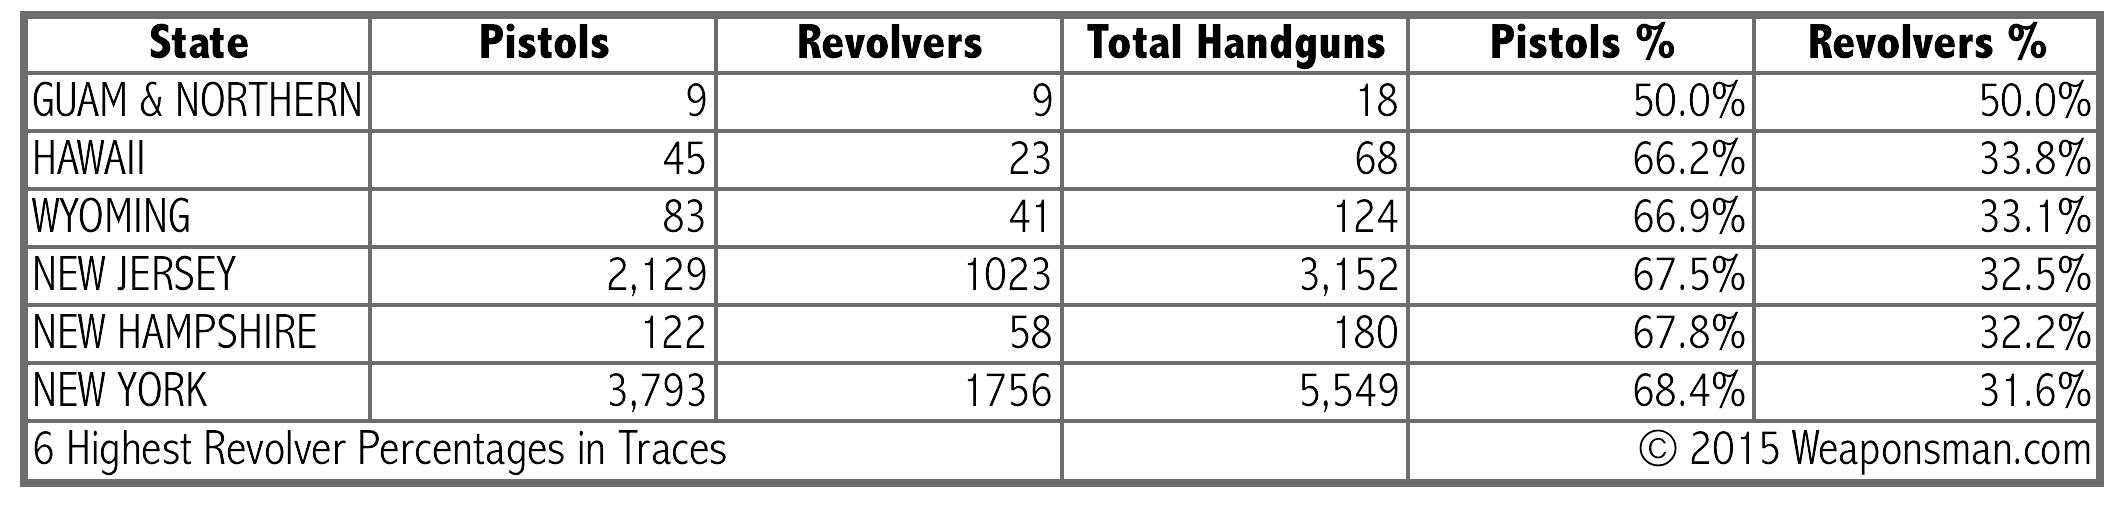
Fascinating that the second largest percentage of revolvers was traced to Guam’s neighbor (to the extent anything in the vast Pacific is a neighbor), Hawaii.
At the other end of the spectrum, Puerto Rico shows less of an outlier status, being off only 2% from the next state:
We should probably have put it in the images, but this is all from Calendar Year 2014 data as reported by BATFE.
After the jump, there are some data tables and a linked spreadsheet for playing with them your ownself.
Original ATF spreadsheet:
firearm_types_recovered_and_traced_in_the_united_states_and_territories.xlsx
Weaponsman.com spreadsheet (it has three tabs, not linked to one another; each stands alone):
Weaponsman Revolver Trace Data.xlsx.
Full Table By State Alphabetically
This is what you get when you sort the data alphabetically by state, and leave the totals at the bottom.
| State | Pistols | Revolvers | Total Handguns | Pistols % | Revolvers % |
| ALABAMA | 3,579 | 1069 | 4,648 | 77.0% | 23.0% |
| ALASKA | 361 | 117 | 478 | 75.5% | 24.5% |
| ARIZONA | 4,260 | 1057 | 5,317 | 80.1% | 19.9% |
| ARKANSAS | 472 | 159 | 631 | 74.8% | 25.2% |
| CALIFORNIA | 15,570 | 6710 | 22,280 | 69.9% | 30.1% |
| COLORADO | 1,919 | 541 | 2,460 | 78.0% | 22.0% |
| CONNECTICUT | 646 | 288 | 934 | 69.2% | 30.8% |
| DELAWARE | 522 | 187 | 709 | 73.6% | 26.4% |
| DISTRICT OF COLUMBIA | 791 | 324 | 1,115 | 70.9% | 29.1% |
| FLORIDA | 11,238 | 3761 | 14,999 | 74.9% | 25.1% |
| GEORGIA | 6,984 | 1963 | 8,947 | 78.1% | 21.9% |
| GUAM & NORTHERN MARIANA ISLANDS | 9 | 9 | 18 | 50.0% | 50.0% |
| HAWAII | 45 | 23 | 68 | 66.2% | 33.8% |
| IDAHO | 385 | 105 | 490 | 78.6% | 21.4% |
| ILLINOIS | 6,394 | 2716 | 9,110 | 70.2% | 29.8% |
| INDIANA | 3,500 | 863 | 4,363 | 80.2% | 19.8% |
| IOWA | 730 | 186 | 916 | 79.7% | 20.3% |
| KANSAS | 1,298 | 302 | 1,600 | 81.1% | 18.9% |
| KENTUCKY | 1,777 | 544 | 2,321 | 76.6% | 23.4% |
| LOUISIANA | 4,306 | 1214 | 5,520 | 78.0% | 22.0% |
| MAINE | 132 | 51 | 183 | 72.1% | 27.9% |
| MARYLAND | 3,058 | 1374 | 4,432 | 69.0% | 31.0% |
| MASSACHUSETTS | 857 | 367 | 1,224 | 70.0% | 30.0% |
| MICHIGAN | 3,207 | 1028 | 4,235 | 75.7% | 24.3% |
| MINNESOTA | 1,258 | 352 | 1,610 | 78.1% | 21.9% |
| MISSISSIPPI | 1,550 | 465 | 2,015 | 76.9% | 23.1% |
| MISSOURI | 3,050 | 729 | 3,779 | 80.7% | 19.3% |
| MONTANA | 220 | 66 | 286 | 76.9% | 23.1% |
| NEBRASKA | 520 | 157 | 677 | 76.8% | 23.2% |
| NEVADA | 1,802 | 554 | 2,356 | 76.5% | 23.5% |
| NEW HAMPSHIRE | 122 | 58 | 180 | 67.8% | 32.2% |
| NEW JERSEY | 2,129 | 1023 | 3,152 | 67.5% | 32.5% |
| NEW MEXICO | 783 | 217 | 1,000 | 78.3% | 21.7% |
| NEW YORK | 3,793 | 1756 | 5,549 | 68.4% | 31.6% |
| NORTH CAROLINA | 5,506 | 1913 | 7,419 | 74.2% | 25.8% |
| NORTH DAKOTA | 438 | 155 | 593 | 73.9% | 26.1% |
| OHIO | 6,204 | 1882 | 8,086 | 76.7% | 23.3% |
| OKLAHOMA | 765 | 227 | 992 | 77.1% | 22.9% |
| OREGON | 1,666 | 568 | 2,234 | 74.6% | 25.4% |
| PENNSYLVANIA | 4,848 | 1676 | 6,524 | 74.3% | 25.7% |
| PUERTO RICO | 886 | 144 | 1,030 | 86.0% | 14.0% |
| RHODE ISLAND | 225 | 90 | 315 | 71.4% | 28.6% |
| SOUTH CAROLINA | 2,330 | 769 | 3,099 | 75.2% | 24.8% |
| SOUTH DAKOTA | 88 | 28 | 116 | 75.9% | 24.1% |
| TENNESSEE | 3,044 | 1081 | 4,125 | 73.8% | 26.2% |
| TEXAS | 8,977 | 2329 | 11,306 | 79.4% | 20.6% |
| US VIRGIN ISLANDS | 110 | 21 | 131 | 84.0% | 16.0% |
| UTAH | 590 | 141 | 731 | 80.7% | 19.3% |
| VERMONT | 71 | 30 | 101 | 70.3% | 29.7% |
| VIRGINIA | 4,057 | 1106 | 5,163 | 78.6% | 21.4% |
| WASHINGTON | 1,890 | 563 | 2,453 | 77.0% | 23.0% |
| WEST VIRGINIA | 396 | 156 | 552 | 71.7% | 28.3% |
| WISCONSIN | 2,121 | 544 | 2,665 | 79.6% | 20.4% |
| WYOMING | 83 | 41 | 124 | 66.9% | 33.1% |
| Totals | 131,562 | 43,799 | 175,361 | 75.0% | 25.0% |
| Alphabetical by State Data | © 2015 Weaponsman.com |
Table by Revolver Percentage
As you might expect, sorting by %age of revolvers makes totals (where the percentage will be, naturally, the overall average) fall right in the middle. We’re not entirely sure what to make of it. For instance, the extremes on both ends are isolated islands with stricter-than-mainland gun control laws.
It would be interesting to add a column for Region. You can see at a glance that all the New England and Northeastern states have above-average revolver percentages, and, Old West imagery notwithstanding, all the Southwest has a below-average share of revolvers traced. (But then, Wyoming is very high on the list, in the Top 6 above). Maybe most of the heirloom Peacemakers are held by white hats.
If gun control laws had an impact on whether “older-fashioned” revolvers or “more-modern” automatics are more frequently traced (scare quotes used because both firearm types have century-plus histories and current production), that impact is not immediately apparent. States with very punitive (Hawaii, PR, New York) and states with very liberal laws (Wyoming, NH, Utah, Kansas) are found on both ends of the distribution.
| State | Pistols | Revolvers | Total Handguns | Pistols % | Revolvers % |
| PUERTO RICO | 886 | 144 | 1,030 | 86.0% | 14.0% |
| US VIRGIN ISLANDS | 110 | 21 | 131 | 84.0% | 16.0% |
| KANSAS | 1,298 | 302 | 1,600 | 81.1% | 18.9% |
| UTAH | 590 | 141 | 731 | 80.7% | 19.3% |
| MISSOURI | 3,050 | 729 | 3,779 | 80.7% | 19.3% |
| INDIANA | 3,500 | 863 | 4,363 | 80.2% | 19.8% |
| ARIZONA | 4,260 | 1057 | 5,317 | 80.1% | 19.9% |
| IOWA | 730 | 186 | 916 | 79.7% | 20.3% |
| WISCONSIN | 2,121 | 544 | 2,665 | 79.6% | 20.4% |
| TEXAS | 8,977 | 2329 | 11,306 | 79.4% | 20.6% |
| VIRGINIA | 4,057 | 1106 | 5,163 | 78.6% | 21.4% |
| IDAHO | 385 | 105 | 490 | 78.6% | 21.4% |
| NEW MEXICO | 783 | 217 | 1,000 | 78.3% | 21.7% |
| MINNESOTA | 1,258 | 352 | 1,610 | 78.1% | 21.9% |
| GEORGIA | 6,984 | 1963 | 8,947 | 78.1% | 21.9% |
| COLORADO | 1,919 | 541 | 2,460 | 78.0% | 22.0% |
| LOUISIANA | 4,306 | 1214 | 5,520 | 78.0% | 22.0% |
| OKLAHOMA | 765 | 227 | 992 | 77.1% | 22.9% |
| WASHINGTON | 1,890 | 563 | 2,453 | 77.0% | 23.0% |
| ALABAMA | 3,579 | 1069 | 4,648 | 77.0% | 23.0% |
| MISSISSIPPI | 1,550 | 465 | 2,015 | 76.9% | 23.1% |
| MONTANA | 220 | 66 | 286 | 76.9% | 23.1% |
| NEBRASKA | 520 | 157 | 677 | 76.8% | 23.2% |
| OHIO | 6,204 | 1882 | 8,086 | 76.7% | 23.3% |
| KENTUCKY | 1,777 | 544 | 2,321 | 76.6% | 23.4% |
| NEVADA | 1,802 | 554 | 2,356 | 76.5% | 23.5% |
| SOUTH DAKOTA | 88 | 28 | 116 | 75.9% | 24.1% |
| MICHIGAN | 3,207 | 1028 | 4,235 | 75.7% | 24.3% |
| ALASKA | 361 | 117 | 478 | 75.5% | 24.5% |
| SOUTH CAROLINA | 2,330 | 769 | 3,099 | 75.2% | 24.8% |
| Totals | 131,563 | 43,799 | 175,362 | 75.0% | 25.0% |
| FLORIDA | 11,238 | 3761 | 14,999 | 74.9% | 25.1% |
| ARKANSAS | 472 | 159 | 631 | 74.8% | 25.2% |
| OREGON | 1,666 | 568 | 2,234 | 74.6% | 25.4% |
| PENNSYLVANIA | 4,848 | 1676 | 6,524 | 74.3% | 25.7% |
| NORTH CAROLINA | 5,506 | 1913 | 7,419 | 74.2% | 25.8% |
| NORTH DAKOTA | 438 | 155 | 593 | 73.9% | 26.1% |
| TENNESSEE | 3,044 | 1081 | 4,125 | 73.8% | 26.2% |
| DELAWARE | 522 | 187 | 709 | 73.6% | 26.4% |
| MAINE | 132 | 51 | 183 | 72.1% | 27.9% |
| WEST VIRGINIA | 396 | 156 | 552 | 71.7% | 28.3% |
| RHODE ISLAND | 225 | 90 | 315 | 71.4% | 28.6% |
| DISTRICT OF COLUMBIA | 791 | 324 | 1,115 | 70.9% | 29.1% |
| VERMONT | 71 | 30 | 101 | 70.3% | 29.7% |
| ILLINOIS | 6,394 | 2716 | 9,110 | 70.2% | 29.8% |
| MASSACHUSETTS | 857 | 367 | 1,224 | 70.0% | 30.0% |
| CALIFORNIA | 15,570 | 6710 | 22,280 | 69.9% | 30.1% |
| CONNECTICUT | 646 | 288 | 934 | 69.2% | 30.8% |
| MARYLAND | 3,058 | 1374 | 4,432 | 69.0% | 31.0% |
| NEW YORK | 3,793 | 1756 | 5,549 | 68.4% | 31.6% |
| NEW HAMPSHIRE | 122 | 58 | 180 | 67.8% | 32.2% |
| NEW JERSEY | 2,129 | 1023 | 3,152 | 67.5% | 32.5% |
| WYOMING | 83 | 41 | 124 | 66.9% | 33.1% |
| HAWAII | 45 | 23 | 68 | 66.2% | 33.8% |
| GUAM & NORTHERN MARIANA ISLANDS | 9 | 9 | 18 | 50.0% | 50.0% |
| By Revolver Percentage Data | © 2015 Weaponsman.com |
Other columns that would be interesting to add would be one of state population, and one of state crime data (the most reliable crime data point, and the one least subject to statistical and classification jiggery-pokery by dishonest top cops looking to massage the numbers, is homicides or murders. A stroke of a key can, and does in places like New York, erase assaults, home invasions and rapes, but if you have a dead body even NYFC’s corrupted CompStat has to count it).
There are also much more comprehensive descriptive statistics that can be run on this data and would probably reveal all kinds of enlightening things. Also, past ATF releases can be groomed for trends. A bit surprising that ATF, which has more money than God, doesn’t already have a team of statisticians or at least a couple MBAs or maths undergrads going through these.

Kevin was a former Special Forces weapons man (MOS 18B, before the 18 series, 11B with Skill Qualification Indicator of S). His focus was on weapons: their history, effects and employment. He started WeaponsMan.com in 2011 and operated it until he passed away in 2017. His work is being preserved here at the request of his family.
5 thoughts on “Revolvers In ATF Trace Data”
It maybe worthwhile to try this for additional years, to see if this is a continuing pattern or just pure luck of the draw.
I suspect that one thing we would see in a longitudinal analysis is a declining trend in the percentage of revolvers year-by-year.
Maybe it is cultural preference based. After all, there is something visceral about a revolver that maybe only a 1911 45acp can match. Hard to define, it seems to me a revolver has a certain appeal in the hand and to the eye. Some are serious pieces of industrial art. Form follows function.
Then again, it could be a case of Veterans Administration circular filing system at work. And that varies from regional operations to regional operations.
Talk about outliers, that is a lot of work compiling that trace data. For a federal agency to actually produce that amount of data seems remarkable. What with Ashley Madison and the one eyed federal employee baby sitter, aka computer porn, where do they find the time to actually do their jobs?
I have automatics, but my revolver collection out numbers them.
I like revolvers.
I like them a lot.
I usually steer the nurses who ask my advice towards revolvers.
Doctors who will not practice get the same advice.
They are always new to guns and are never going to practice on a regular basis.
I take them to the range and let them shoot semi autos and revolvers
Racking the slide and clearing malfunctions are always a problem for the women.
Some do persevere and get a semi auto.
The majority get a 4 inch revolver for a bedside table gun.
Some opt to carry a Smith and Wesson bodyguard or Ruger LCR.
I am a huge fan of laser sights on any pistol. It makes shooting from unusual positions easy. It also makes it possible to score hits when shooting while running.(away)
We practice shooting around the car while at the secret Everglades shooting spot. They pretend to be filling the tank. I set up a target on a rolling stand and pull the rope. We start with Zombie dog targets and move up to human targets.
No one has shot my car yet!